Neighbors. Empowered.

Fiscal Year 22 Annual Report

July 1, 2021–June 30, 2022

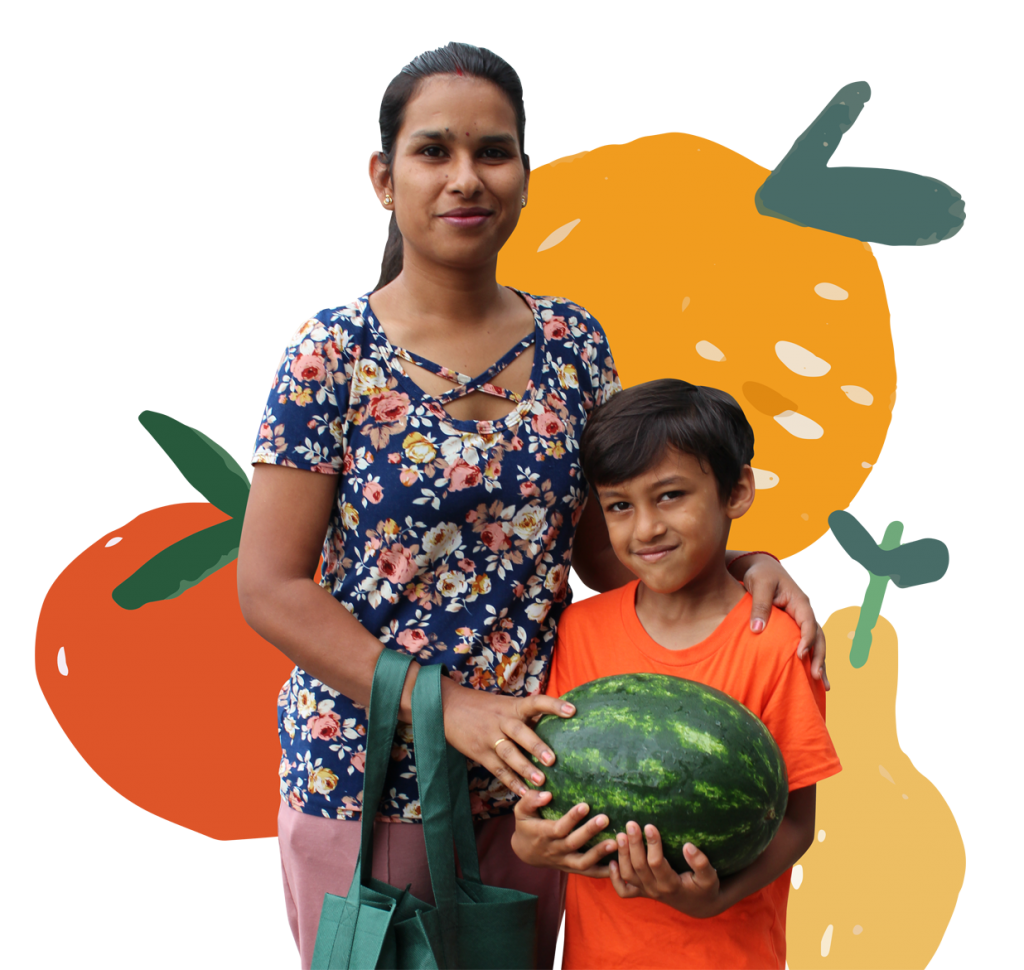
We are all neighbors whether we’re the ones giving or receiving help. When we unite together we’re empowered to build a stronger, healthier community. That’s Neighbors. Empowered.

CEO Annual Letter

This letter to our Food Bank family highlights the extraordinary accomplishments we achieved in the last year and how we will continue to innovate and advocate to help everyone in Northern Illinois have access to the food they need to thrive.

FY22 Statistics and Stories

78M
27%
2M
130K

FY22 Statistics by County

Click each county to view statistics for the 13 counties we serve in Northern Illinois

All 13 Counties

Food insecure neighbors:
400k
Food Insecure Children:
100k
Total agencies:
900+
FY22 Total Meals distributed:
78 Million

Boone

Neighbors experiencing food insecurity:
6,300
Overall food insecurity rate:
11.8%
Total agencies:
24
FY22 Total Meals distributed:
1.5 million

DeKalb

Neighbors experiencing food insecurity:
14,100
Overall food insecurity rate:
13.5%
Total agencies:
47
FY22 Total Meals distributed:
2.3 million

DuPage

Neighbors experiencing food insecurity:
85,200
Overall food insecurity rate:
9.2%
Total agencies:
117
FY22 Total Meals distributed:
16.4 million

Grundy

Neighbors experiencing food insecurity:
5,400
Overall food insecurity rate:
10.7%
Total agencies:
6
FY22 Total Meals distributed:
519,000

Kane

Neighbors experiencing food insecurity:
53,200
Overall food insecurity rate:
10.0%
Total agencies:
104
FY22 Total Meals distributed:
10.3 million

Kankakee

Neighbors experiencing food insecurity:
14,800
Overall food insecurity rate:
13.5%
Total agencies:
31
FY22 Total Meals distributed:
2 million

Kendall

Neighbors experiencing food insecurity:
9,700
Overall food insecurity rate:
7.6%
Total agencies:
10
FY22 Total Meals distributed:
1.4 million

Lake

Neighbors experiencing food insecurity:
68,600
Overall food insecurity rate:
9.8%
Total agencies:
121
FY22 Total Meals distributed:
12.8 million

McHenry

Neighbors experiencing food insecurity:
29,800
Overall food insecurity rate:
9.7%
Total agencies:
53
FY22 Total Meals distributed:
4.9 million

Ogle

Neighbors experiencing food insecurity:
6,400
Overall food insecurity rate:
12.6%
Total agencies:
24
FY22 Total Meals distributed:
671,000

Stephenson

Neighbors experiencing food insecurity:
6,400
Overall food insecurity rate:
14.3%
Total agencies:
36
FY22 Total Meals distributed:
656,000

Will

Neighbors experiencing food insecurity:
64,100
Overall food insecurity rate:
9.3%
Total agencies:
127
FY22 Total Meals distributed:
11.8 million

Winnebago

Neighbors experiencing food insecurity:
44,800
Overall food insecurity rate:
15.8%
Total agencies:
116
FY22 Total Meals distributed:
8.8 million

DONATE.
VOLUNTEER.
GET INVOLVED.

Visit our website to learn more about ways you can help solve hunger in our community.

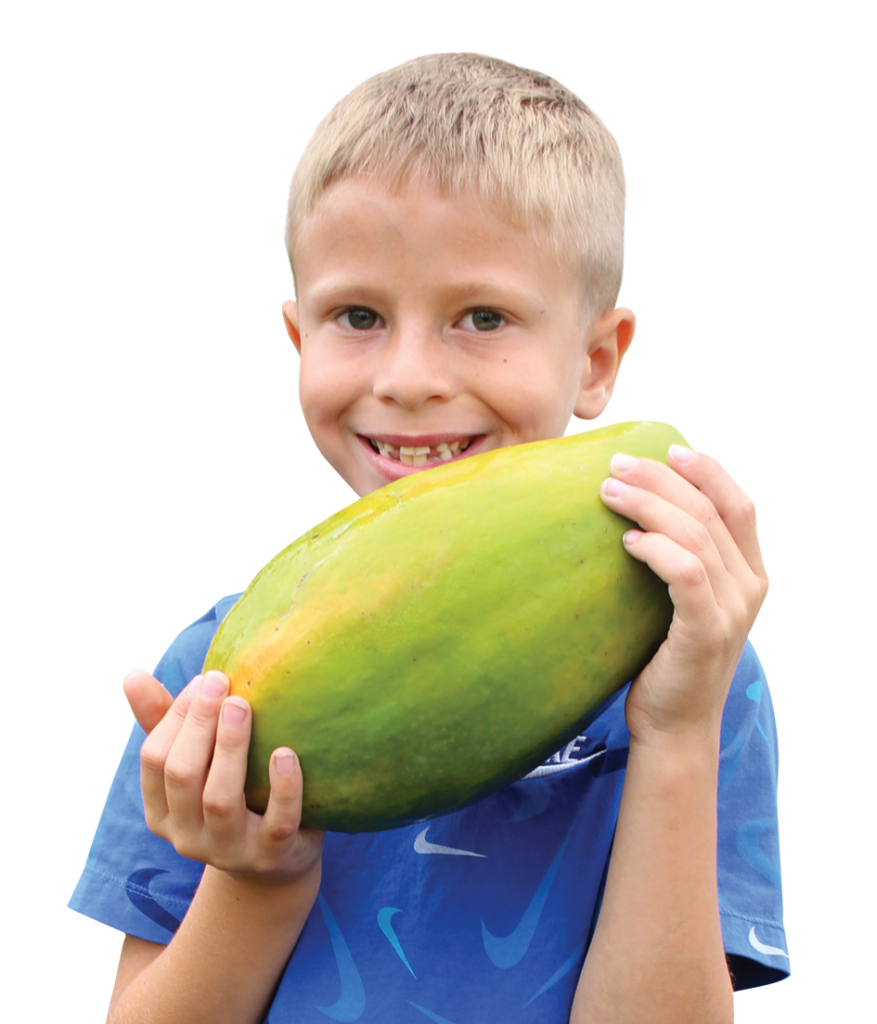
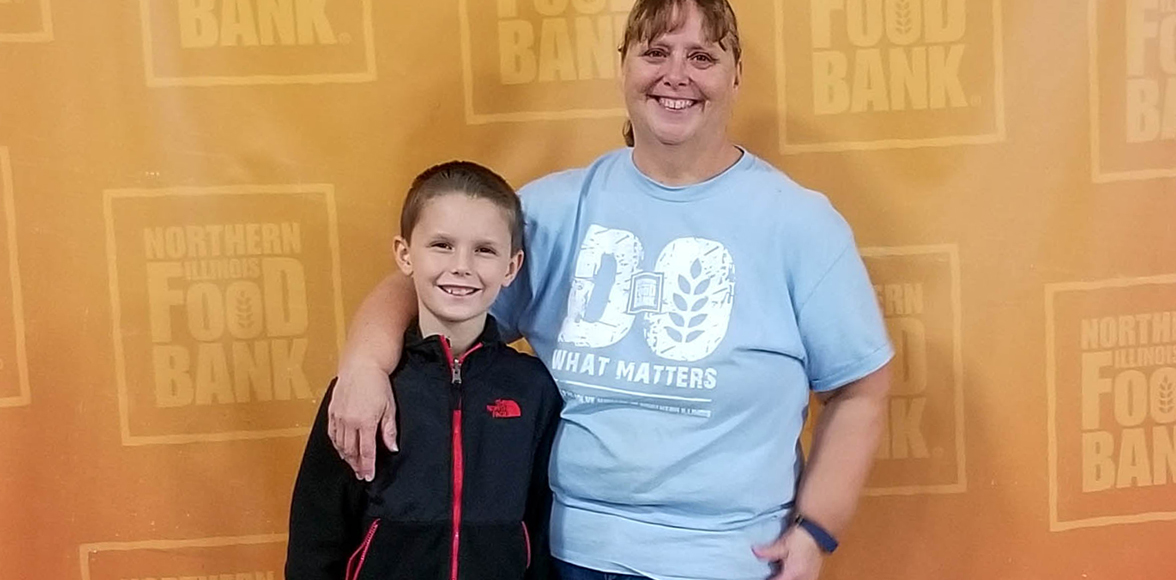
“Kids are more ready to be engaged in whatever they’re doing when they have a healthy meal.”

-Elizabeth
Food Bank Summer Food Service Program Partner

arrow_upward